Глобальні виклики зернового ринку: як брокери справляються з кризами та які тенденції визначатимуть розвиток торгівлі
Grain Market: Eight Factors That Will Influence Grain Prices Until 2030
04 June 2026, 07:01 1844
 Dmytro Verlan
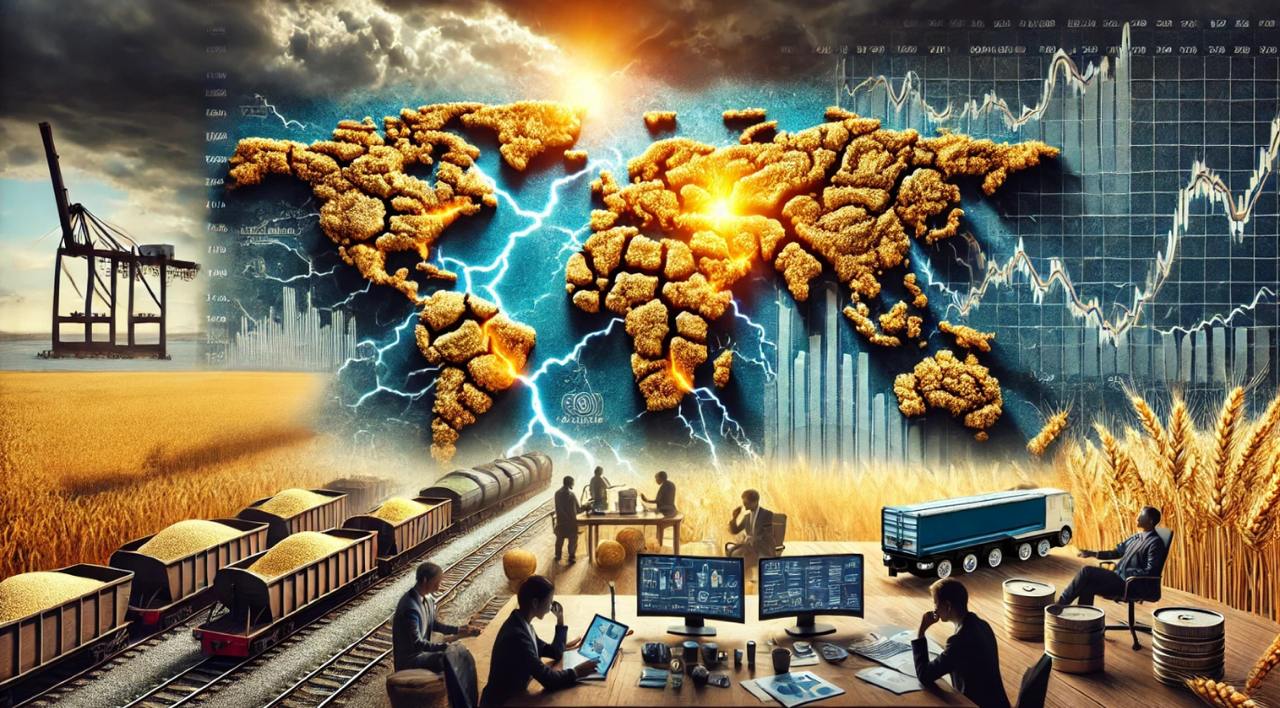
 The wheat and corn market is entering its most turbulent period in the past thirty years. Previous crises — the global food crisis of 2007–2008, supply disruptions in 2010 and the U.S. drought in 2012 — were largely driven by a single factor: a harvest shock, a spike in oil prices or a short-term financial panic. Today, the global grain market is being pressured simultaneously by at least eight structural factors.
These include, in particular:
- the ongoing armed conflict in the Black Sea region;
- the geopolitical fragmentation of trade flows;
- the high cost of capital and fertilizers;
- the restructuring of logistics routes;
- the long-term degradation of Ukraine’s production capacity.
None of the previous cycles combined all these challenges at the same time — and this is what makes the current moment qualitatively different.
Wheat and corn, which together provide more than 40% of global calorie consumption, are now at the intersection of geopolitical conflicts, climate challenges and structural economic shifts. The old logic of price forecasting — seasonality, supply and demand balance, exchange rates — is no longer sufficient.
Until 2030, the market will be shaped by at least eight interconnected factors. Even each of them separately is capable of significantly changing the global grain market environment. Together, they create a new reality in which those who understand the systemic relationship between politics, energy, logistics and agricultural production will gain the advantage.
Geopolitical and Military Instability
Russia’s full-scale invasion of Ukraine in February 2022 became a turning point for the global grain market. For the first time in decades, an armed conflict affected two key players at once: Ukraine, one of the largest exporters of corn and wheat, and Russia, which is expanding its own agricultural export potential under conditions of isolation and sanctions.
It is important to understand that the market no longer perceives this war as a temporary shock. The conflict has already become a structural factor in price formation. The Black Sea Grain Initiative, which operated from August 2022 to July 2023, allowed Ukraine to restore part of its maritime exports. After its termination, export volumes declined: according to USDA data, the forecast for Ukrainian grain exports in the 2023/24 MY fell by 27% compared with the previous season and by 28% compared with the pre-war five-year average. In the 2024/25 MY, Ukraine’s harvest declined due to drought; in addition, EU quotas restricted part of export flows. In the 2025/26 MY, the decline is significant.
By contrast, Russia used the situation to its advantage: in the 2023/24 MY, its wheat exports, according to USDA estimates, reached a record 51 million tonnes. In the 2024/25 MY, Russia faced the consequences of its own record — domestic stocks were depleted, and by the end of the season wheat exports fell to 41.5–42.2 million tonnes, 25% below the record level, according to estimates by Rusagrotrans and Agroinvestor.
Until 2030, the duration and intensity of the conflict will remain the main unpredictable parameter in many market models.
However, the Black Sea region is not the only geography of risk. At least two other areas of tension could also potentially destabilize global food supply chains:
- China — Taiwan. The Taiwan Strait is a strategic corridor for 40–50% of global container traffic. An escalation around Taiwan, even without a direct armed conflict, would lead to a sharp increase in freight rates, insurance premiums and long delays in grain supplies to Asia and Oceania — regions where Ukraine, Australia and the United States compete for market niches.
- The United States — Venezuela / Colombia / Cuba. Increased U.S. sanctions pressure in the Caribbean, although not a direct factor for the grain market, affects regional logistics corridors and Latin American attitudes toward expanding trade relations with the United States. This may accelerate the reorientation of a number of countries in the region toward non-Western grain suppliers.
Iran: The Strait of Hormuz, Oil, Fertilizers and Grain
Iran rarely appears directly in grain market analysis — and wrongly so. Its influence is indirect but systemic, and it operates through three channels: oil exports, the fertilizer market and, increasingly, Iran’s own grain imports.
- The Strait of Hormuz is the narrowest bottleneck of global energy. According to EIA and Statista, in 2024 around 20.3 million barrels of oil and petroleum products passed through it every day, representing approximately one-fifth of global oil consumption and more than a quarter of all seaborne oil trade. There is no real alternative route for such a volume. Any escalation in the region — from diplomatic pressure to physical attacks on tankers — is immediately reflected in freight rates and diesel prices, which are direct components of the cost of agricultural production and grain transportation. The events of 2025–2026 showed that this threat is not hypothetical, but entirely real.
- The second channel is fertilizers. The Gulf countries, including Iran, are significant producers of nitrogen fertilizers. Sanctions pressure on Iran limits its legal presence on the market, but real flows through third countries continue to exist. At the same time, any escalation in the Hormuz area puts fertilizer supplies from the region to key importers in Asia and Africa at risk. This mechanism was triggered in the spring of 2026, when tensions in the strait accelerated the increase in urea prices to $826/t — the highest level since the end of 2022.
- The third and increasingly important channel is Iran as a major wheat buyer. Wheat production in Iran has recently been declining: USDA estimated the 2024/25 MY harvest at 13.5 million tonnes compared with 16 million tonnes a year earlier. With domestic consumption at 16.95 million tonnes, the structural deficit amounts to 3.45 million tonnes and is covered exclusively by imports. In April–October 2025 alone, Iran imported 1.125 million tonnes of wheat worth $424 million. In May 2025, Iran ranked first among buyers of Russian wheat, purchasing 342,000 tonnes in one month. Iran’s presence on the market as a large irregular buyer creates additional instability in price quotations.
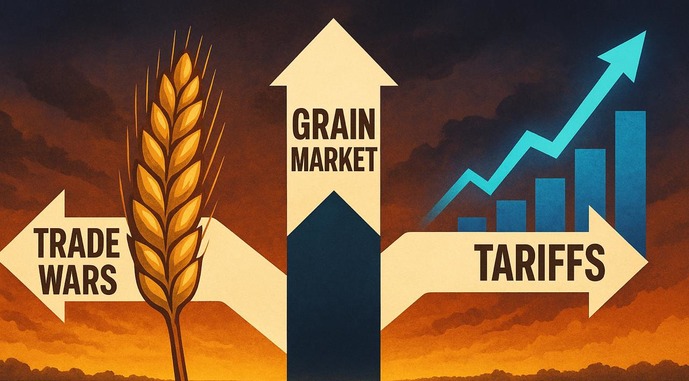
The United States, China and the EU: Tariff Wars, Protectionism and the New Trade Map
The U.S.–China trade confrontation, which resumed with renewed intensity in 2025, clearly demonstrated that the grain market is vulnerable to decisions made not in the fields, but in negotiation rooms. However, this bilateral confrontation is only part of a broader picture. At the same time, the European Union is pursuing its own trade strategy, which directly affects the competitive positions of all grain suppliers.
In February 2025, China introduced an additional 10% duty on U.S. soybeans on top of the basic 3% tariff. The result was dramatic: U.S. soybean exports to China in 2025 fell to 7.4 million tonnes — almost 72% less than in 2024.
From May to November 2025, China effectively reduced purchases of U.S. soybeans to zero. Negotiations at the Trump–Xi meeting ended with an agreement: Beijing committed to purchasing 12 million tonnes in November–December 2025 and 25 million tonnes annually in 2026–2028. However, this agreement itself illustrates the main trend until 2030: trade flows of grains and oilseeds will increasingly be determined by political rather than market decisions.
For U.S. wheat and corn, this process means one thing: China is actively diversifying its suppliers. Brazil and Argentina have already significantly increased their share of the Chinese market. If U.S.–China tensions persist — and all prerequisites for this remain in place — Latin America will consolidate its positions, while the United States will be forced to look for alternative markets, intensifying competition with Ukraine and the EU.
In this context, the European Union acts as a dual player: it is both a major producer and consumer of grain, and an active regulator of access to its market. After mass farmer protests in 2024, the EU restored the quota regime for Ukrainian grain. At the beginning of the 2025/26 MY, grain imports from Ukraine to the EU fell by 57.7% compared with the same period a year earlier — a direct consequence of the restoration of tariff quotas. At the same time, in July 2025, the EU and the United States concluded a framework agreement, the Turnberry Deal, which provides preferential access for U.S. agricultural products to the EU market — a potential threat to the competitive positions of other suppliers. Thus, the trade map of the grain market until 2030 is being shaped not by U.S.–China relations alone, but by a trilateral dynamic in which the EU’s position may prove decisive.
Global Inflation and Credit Pressure on Agricultural Producers
The high cost of capital remains one of the least discussed but very real factors affecting the grain production base. The cycle of interest rate increases in 2022–2024 significantly increased the cost of financing sowing campaigns around the world — from small farmers in Egypt to large agricultural holdings in Ukraine and Argentina.
This issue is especially acute for grain-importing countries in emerging markets. A stronger dollar, rising external debt servicing costs and shrinking foreign exchange reserves are forcing a number of countries in Africa and the Middle East to reduce or postpone import purchases. In the absence of sufficient strategic reserves, this turns into a food security risk. In turn, it reduces effective demand and puts pressure on FOB prices. Until 2030, inflationary pressure and the monetary policy of leading central banks will remain a background but constant factor of volatility.

Fertilizers and Gas: A Structural Increase in Production Costs
If 2022 was the year of a shock increase in fertilizer prices, 2025–2026 showed that the market has not only failed to return to its pre-war «normal,» but has also moved to a new price level. In March 2022, the price of urea reached $801/t compared with $245/t in November 2020. After the correction of 2023–2024, the market moved upward again: in October 2025, a tonne of urea cost $416/t in the United States and $422/t in South America. By April 2026, prices accelerated: $826/t on the U.S. market and $725/t in the global benchmark — the highest level in four years. The key driver was a new wave of escalation around the Strait of Hormuz, which raised natural gas prices and reduced fertilizer supplies from the Gulf.
Forecast: In its Commodity Markets Outlook report of April 2026, the World Bank estimates that urea prices will rise by around 60% year-on-year in 2026, potentially exceeding $700/t — the second-highest level since 1974. In 2027, a decline of around 25% is expected if supplies from the Middle East recover and new production capacities are launched. For agricultural producers, this means one thing: the cost of growing wheat and corn in 2026–2030 will be structurally higher than in any previous year after 2022.
FAO directly warns that reduced fertilizer application due to unaffordability could lower wheat, corn and rice yields within a 6–9-month horizon. Until 2030, fertilizers will remain one of the largest components of production costs and one of the most sensitive to external risks.
Freight and Logistics: A New Geography of Supplies and a Permanent Risk Premium
The grain market is not only a production market, but also a logistics market. Freight is not merely a cost; it is an indicator of how the global grain distribution system copes with stress. After 2022, Black Sea risk became a permanent component of insurance premiums and higher freight rates for vessels entering the region. This leads to competitive losses for Ukrainian grain compared with Argentine or Australian grain, even at equal FOB prices.
At the same time, logistics routes are being reformatted: the Danube corridor, Polish and Romanian ports and railway crossings. These routes are more expensive and slower than traditional Black Sea shipments, but they have become a reality that will remain even after the active phase of the war ends. The regional reformatting of logistics is irreversible in the horizon until 2030 — infrastructure investments have already been made, and routes have already been tested.

Loss and Degradation of Ukraine’s Agricultural Land
The reduction of Ukraine’s agricultural potential is not only a question of the current harvest. It is a long-term structural deficit in supply that will be felt for years after the end of hostilities.
The figures are telling:
- according to USDA/IFPRI, harvested wheat areas in Ukraine in the 2023/24 MY fell by 32%, corn by 27% and barley by 37% compared with 2021/22 MY levels;
- the total net area under six major crops decreased by 19.5%.
In the pre-war decade, corn production in Ukraine doubled — from 21 million tonnes in the 2012/13 MY to 42 million tonnes in 2021/22. Today, these levels are unattainable not only because of direct hostilities, but also because of three interconnected problems:
- occupied and mined territories, with various estimates suggesting that 10 to 15 million hectares remain mined or unsuitable for further use;
- destruction of irrigation and storage infrastructure;
- mass outflow of rural labor and agribusiness from frontline areas.
Restoring production potential even after a hypothetical peace will take at least 5–10 years.

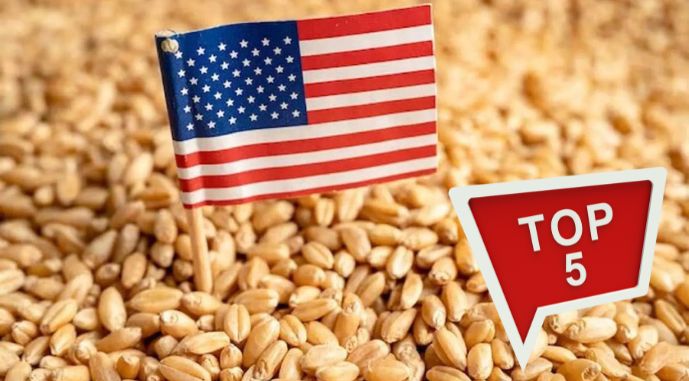
Ukraine: Loss of Export Markets and the Fight to Regain Positions
Before 2022, Ukraine was among the world’s top five wheat exporters and ranked sixth among corn exporters. Traditional export markets — Egypt, Indonesia, Turkey, Bangladesh, Pakistan and countries of Sub-Saharan Africa — had been built over years and were based on reliability of supply and competitive pricing.
After 2022, these markets shifted to alternative suppliers. Russia filled part of this vacuum through aggressive subsidized dumping. Brazil, Argentina and Australia increased their shares in regions that had previously been supplied by Ukraine. Restoring market share amid prolonged logistics uncertainty, insurance surcharges and competition from suppliers without war risk is one of the most difficult tasks for Ukraine’s agricultural sector until 2030.
Still, there is hope. The Danube and maritime corridors have clearly demonstrated their effectiveness over the past four years. We hope that European integration preferences will once again open broader access to the EU market. Bilateral intergovernmental agreements with countries in Africa and the Middle East are gradually restoring trade relations.
However, a return to pre-war volumes and geography is unlikely to be achieved by 2030 if hostilities continue. This is a complex task that includes not only a guaranteed end to hostilities, but also the restoration of production potential, transport and port infrastructure, as well as the fertility of Ukrainian black soils in the east and south, which has been damaged since 2022.
Conclusion: A Market That No Longer Forgives Ignorance
The wheat and corn market until 2030 is a market with a permanently elevated level of structural risk. Traditional forecasting tools — the seasonal cycle, weather models, USDA/WASDE reports — remain necessary, but are no longer sufficient. Geopolitics, energy, trade diplomacy and the state of infrastructure have become equal factors in price formation.
For traders, this means one thing: understanding the market today is impossible without simultaneously understanding what is happening in Washington, Beijing, Tehran and on the frontline in Ukraine. Market participants who are able to correctly assess and integrate all eight factors into their operational and strategic planning will gain a competitive advantage — regardless of which side of the transaction they are on.
Dmytro Verlan, professional grain broker with 14 years of experience in grain and oilseed trading on the Black Sea and Mediterranean markets.


The author's opinion may not coincide with the editorial opinion. The author is responsible for the quotes, facts and figures given in the text.